Sjmarf@sh.itjust.works to Memes@lemmy.ml · 3 years agoAstonishingsh.itjust.worksimagemessage-square111fedilinkarrow-up11.31Karrow-down130
arrow-up11.28Karrow-down1imageAstonishingsh.itjust.worksSjmarf@sh.itjust.works to Memes@lemmy.ml · 3 years agomessage-square111fedilink
minus-squareDrDr@lemmy.worldlinkfedilinkarrow-up7·3 years agoIt would almost certainly follow an approximate normal distribution just like the above graph. Why would it look different?

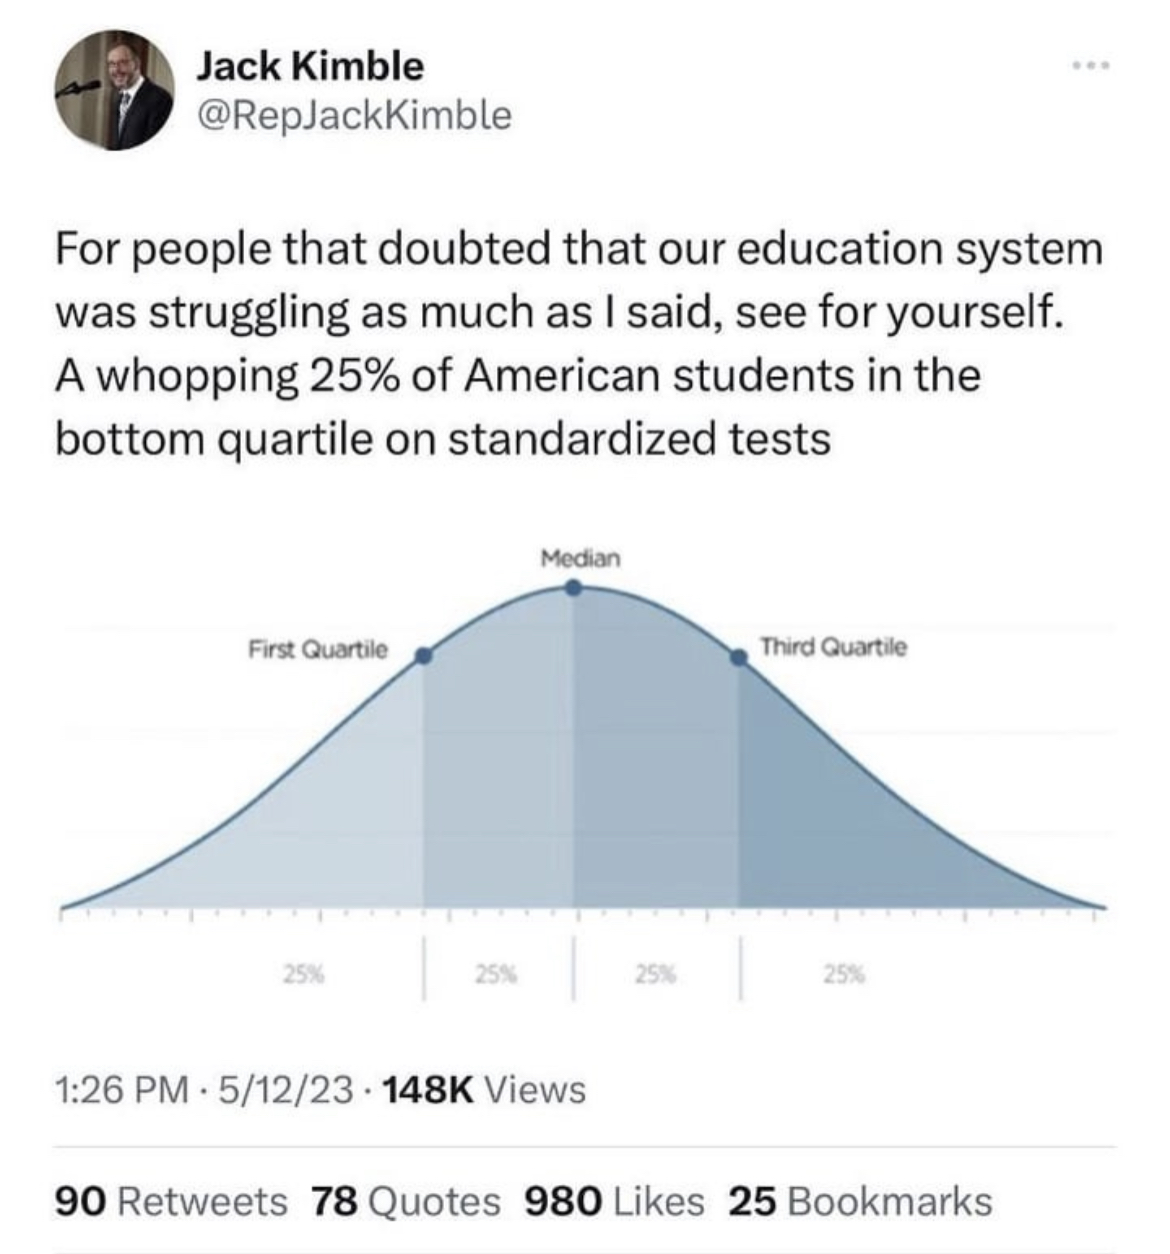
It would almost certainly follow an approximate normal distribution just like the above graph. Why would it look different?